The Ticker
Bull Market
The market's got one eye on a peace deal and one hand reaching for the punch bowl — it's a summer barbecue where the guest of honor might not show up, but the steaks are sizzling and nobody's heading home early.
Top Story
US-Iran Road to Peace Hits Turbulence as Strait of Hormuz Hangs in Balance
High-stakes diplomacy between the United States and Iran entered a tense second day Monday in Switzerland, with both sides inching toward a permanent ceasefire framework even as Iran rattled markets by threatening again to close the critical Strait of Hormuz. Mediators from Qatar and Pakistan declared "encouraging progress," but the fate of a deal that could reshape global energy markets and the Middle East remains deeply uncertain.
S&P 500 earnings season is winding down with results broadly above expectations, and the index sits comfortably above its long-term trend — a posture reflecting confidence that corporate America has largely absorbed the inflation shock from the Iran conflict without a meaningful earnings recession. Eyes now turn to Micron and FedEx reporting later this week, with Q1 GDP and May PCE data also due before the month closes.
The Federal Reserve's first meeting under new Chairman Kevin Warsh delivered a hawkish shock to markets last Wednesday. Warsh held rates steady but his committee's dot plot showed half of voting members penciling in at least one rate hike by year-end — a dramatic reversal from the easing path markets had expected entering 2026. Warsh notably declined to submit his own rate projection, adding uncertainty about the central bank's direction while making clear that the Fed's inflation-fighting credibility is non-negotiable.
On the macro front, the Iran war's disruption of global energy supply has been the primary driver of elevated inflation, with headline CPI running at a three-year high. The good news is that oil prices have been easing meaningfully as ceasefire talks have progressed, with Brent crude now near $79 a barrel versus wartime highs above $100. If the Switzerland talks produce a durable framework and the Strait of Hormuz reopens fully, the energy-driven inflation impulse could dissipate — potentially taking the Fed's rate hike threat off the table and reigniting the bull market's next leg. MoreLess
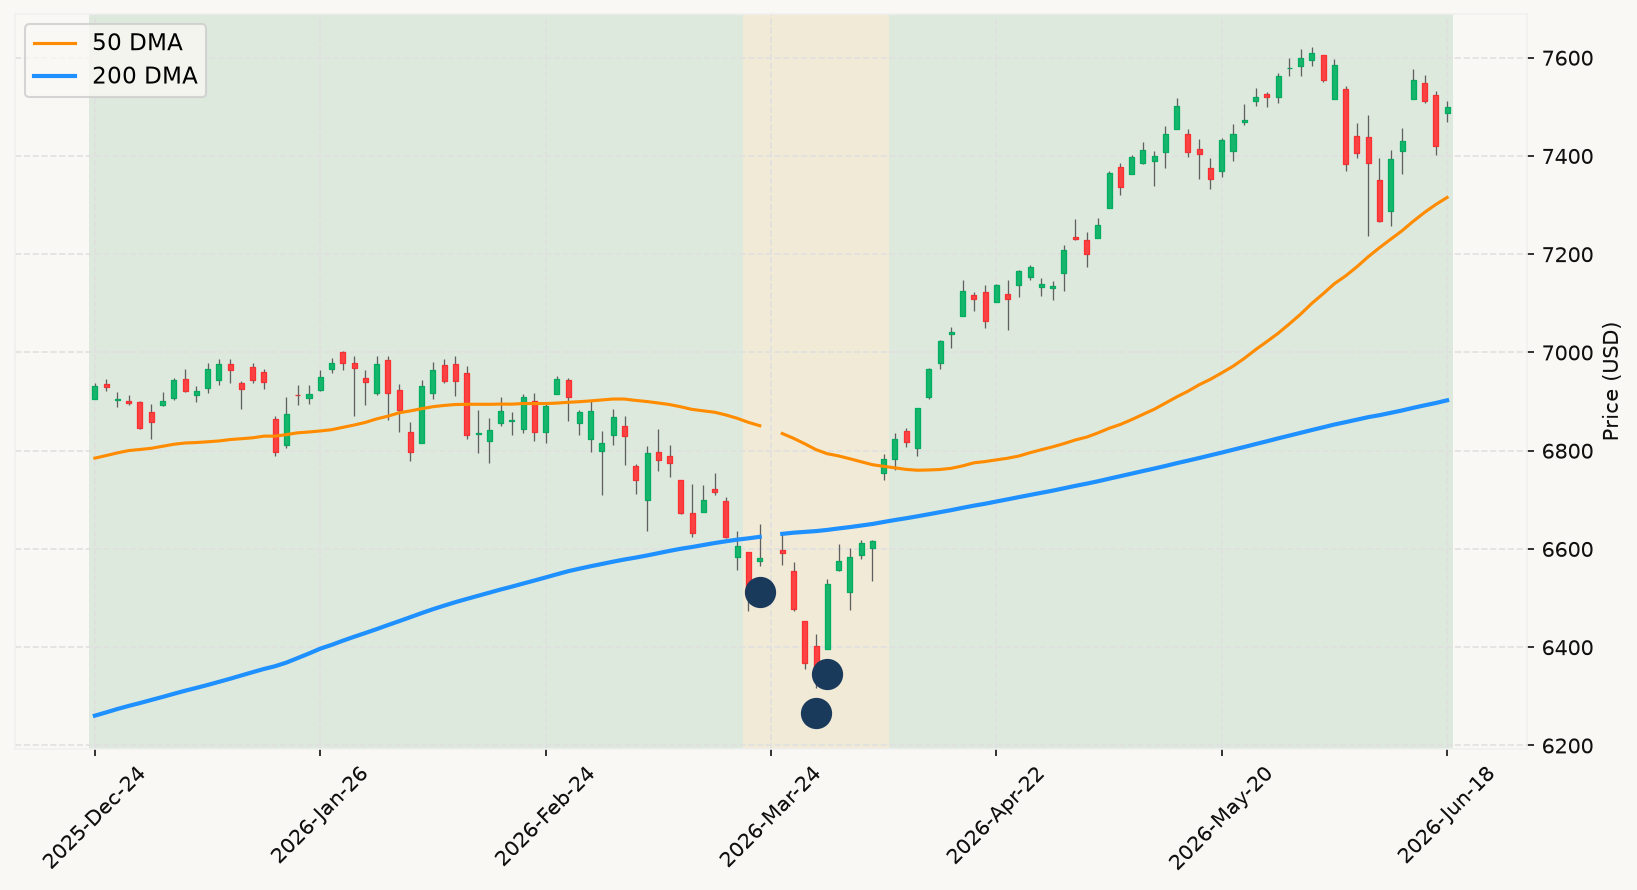
Six Month Chart (SPX)
⊞ Expand
The Ticker Analysis
Bull Market Intact — Iran Risk Is the Setup, Not the Exit
Let's be direct about what the current setup looks like through the lens of history. The market is trading comfortably above its primary trend — sitting roughly 8.7% above the long-term moving average that separates bull from bear regimes — and is within a hair of its all-time high from just three weeks ago. That is not a warning sign. That is historically one of the strongest-performing configurations equities can be in. New all-time highs attract hand-wringing about "how much higher can it go," but the data are unambiguous: markets at or near all-time highs have delivered above-average forward returns across every meaningful time horizon. The burden of proof sits squarely on the bear case, not on the bulls.
So let's apply that burden. The Iran war ceasefire talks dominating today's headlines are the kind of geopolitical drama that generates intense media coverage and genuine uncertainty — but the framework for deciding what to do about it is not complicated. Energy-driven inflation is the primary mechanism by which this conflict has threatened the economic expansion: oil well above $100 at peak, the Strait of Hormuz choked, and the Fed's rate-cutting path obliterated. The reversal of those conditions — oil now back near $79 and falling as diplomacy progresses — is actually the most bullish development the market could ask for. If the Strait reopens fully and energy prices continue to moderate, the inflation impulse that spooked the Fed almost certainly fades. That is not a reason to sell. That is a reason to stay invested.
The Fed's hawkish pivot under Warsh deserves a sober read. Nine of nineteen officials now pencil in a rate hike — that is not nothing, and it explains the post-meeting volatility. But here's the critical context: the entire rate-hike risk is rooted in an energy supply shock that is visibly in the process of resolving. Inflation in the absence of energy shock pressure runs considerably closer to the Fed's target on a core basis. Warsh himself is a data-dependent operator who declined to submit his own rate projection — not the behavior of someone itching to hike. Markets are pricing elevated hike odds into a scenario that may not materialize if diplomacy succeeds. The interest rate environment, which created short-term turbulence, is not yet signaling the kind of sustained inversion or sustained tightening that has historically been part of a recessionary double-signal. The monetary policy picture warrants vigilance, not panic.
The broader macro picture gives little comfort to the bear case. Employment conditions are holding firm — labor market signals show no signs of the kind of broadening deterioration that has characterized every genuine recessionary onset in the modern era. Both real-time growth models are tracking solid positive expansion for the current quarter. The 80% base rate applies here: among every market decline of 10% or more since 1980, only four became prolonged bear markets, and every single one of those coincided with a confirmed recession. We are nowhere near that confirmation. The current drawdown from the all-time high is trivial — barely over 1% — and the market's primary trend remains firmly intact and rising. The correct posture is fully invested, and the biggest risk on the table right now is not a bear market. It's missing the next leg higher when the Iran deal closes and energy markets normalize. MoreLess